Marketing communication
Our analysis shows the dispersion of returns across domestic equity and bond markets will decline over the next five years. This suggests investors should consider investing across sectoral lines and allocate more of their capital to corporate bonds.
Key return projections for the next 5 years
Luca Paolini, Chief Strategist at Pictet Asset Management, shares his insights on what to expect from markets over the next 5 years.
What to expect from markets over the coming five years
The global economy rests on less robust foundations compared to the days when interest rates and inflation were both heading lower and international trade was booming.
Productivity is unlikely to rise much over the remainder of this decade as globalisation stalls and businesses struggle with the growing costs of net zero and labour shortages. As a consequence, we expect only modest GDP growth over the next five years.
Inflation should also prove a stubborn foe; although it will eventually settle within central bank target ranges by the end of this decade, it will be more volatile than policymakers would like.
For active investors, securing superior returns in such an environment means viewing the investment landscape through a different lens.
| CHALLENGE | SOLUTION |
|---|---|
|
|
|
|
|
|
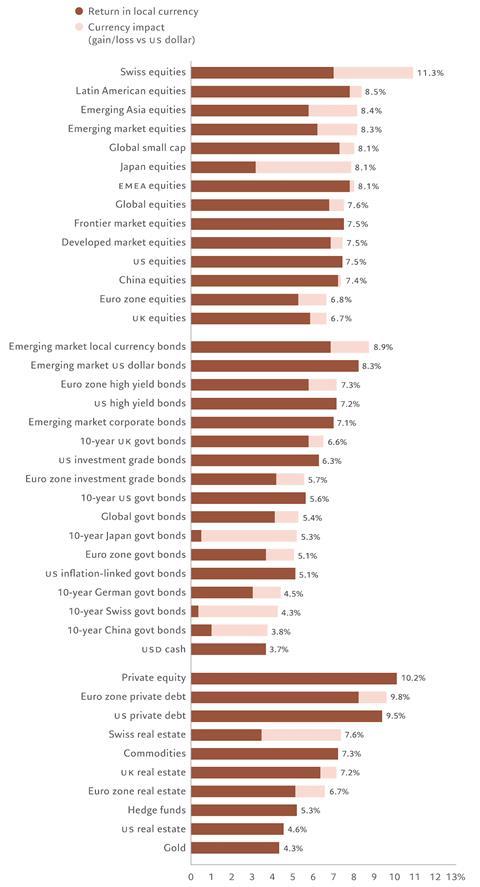
Asset class returns, 5-year forecast, %, annualised

Credit: An attractive entry point?
From US high yield bonds to European private debt, we believe that credit markets offer some of the most attractive entry points and some of the best prospects for returns over the next half a decade. In listed credit, returns are likely to be on a par with equities, but with less risk, less volatility and a broader investment universe. Valuations are attractive, defaults should remain benign, corporate leverage low and interest rate coverage comfortable.
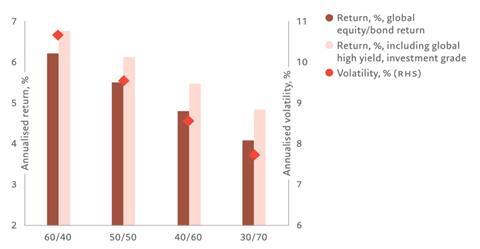
Credit gives better balance
Annualised USD return, volatility, %, for global equity/sovereign bonds portfolio vs enhanced portfolio with global HY/IG credit

In private debt, too, yields look attractive relative to equities on a risk-adjusted basis. This rapidly growing market benefits from floating rates and strong covenants. Across both private and public credit, we see strong investor demand, underpinned by the retirement of baby boomers and by the re-allocation of the trillions of dollars currently parked in money market funds.
Download the full investment outlook
Did you know?
That the private borrowing market is set to reach
USD2.8 trillion
in 2028 from the current USD1.6 trillion.
Source: Preqin.
*Simulated data and projected forecast figures presented in in the Appendix are figures that are hypothetical, unaudited and prepared by Pictet Asset Management (Europe) SA. The results are intended for illustrative purposes only. Past performance is not indicative of future results, which may vary. Projected future performance is not indicative of actual returns and there is a risk of substantial loss. Hypothetical performance results have many inherent limitations, some of which, but not all, are described herein. No representation is being made that any account will or is likely to achieve profits or losses similar to those shown herein. One of the limitations of hypothetical performance results is that they are generally prepared with the benefit of hindsight. The hypothetical performance results contained herein represent the application of the quantitative models as currently in effect on the date first written above, and there can be no assurance that the models will remain the same in the future or that an application of the current models in the future will produce similar results because the relevant market and economic conditions that prevailed during the hypothetical performance period will not necessarily recur. There are numerous other factors related to the markets which cannot be fully accounted for in the preparation of hypothetical performance results, all of which can adversely affect actual performance results. Hypothetical performance results are presented for illustrative purposes only. Indexes are unmanaged, do not reflect management or trading fees, and it is not possible to invest directly in an index. There is no guarantee, express or implied, that long-term return and/or volatility targets will be achieved. Realised returns and/or volatility may come in higher or lower than expected. A full list of the assumptions made can be provided on request.
**Based on volatility matching portfolio, with global high yield added to risk allocation and with global investment grade added to risk-free allocation, while keeping notional risk allocation the same. For optimised portfolio, allocations are as follows: for 60/40, 47.2% equities, 12.8% HY, 40% IG; for 50/50, 34.3% equities, 15.7% IG, 50% HY; for 40/60, 21.4% equities, 18.6% HY, 60% IG; for 30/70, 8.5% equities, 21.5% HY, 70% IG. Benchmarks are MSCI ACWI, FTSE WDBI, ICE BofA Global HY, ICE BofA Global IG. Data covering period 01.05.2004-30.04.2024
Supporting documents
Click link to download and view these filesSecular Outlook June 2024
PDF, Size 1.76 mb


