Corporate overview
Clarion Partners has been a leading real estate investment manager for more than 40 years, using the judgment of our experienced professionals as well as our proprietary research to design real estate investment solutions that create value and have the potential to deliver superior returns. We are distinguished by a performance driven approach, long-term organisational stability, and a mandate of accountability to our clients.
With $73.6bn in total assets under management for approximately 500 institutional investors around the world, Clarion offers a broad range of equity and debt strategies across the risk/return spectrum – from core/core-plus to value-add/opportunistic. The firm, which is headquartered in New York, has over 350 employees and maintains a presence in strategic markets across the United States and Europe. Our strength lies in a well-established network of experienced professionals who bring a deep knowledge of local markets to every investment decision.
Investment principles & strategy
Experience has taught us that attractive investment opportunities can be identified at every phase of the real estate cycle. Clarion Partners invests in high-quality assets across key property types in major markets throughout the US and specifically targets logistics facilities across Europe. We carefully screen each acquisition using in-depth research and rigorous due diligence, focusing on properties that compete effectively over time and are located in markets with consistent capital market liquidity.
Strategic corporate development
Clarion Partners offers investment options in both commingled fund and separate account formats for institutional investors. Clients can select from a broad range of debt and equity investment options to build their real estate portfolios, including diversified core portfolios, sector-specific accounts, core, core-plus and value-add products as well as opportunistic vehicles. Going forward, we will continue to build our business by offering our clients real estate solutions that have been tailored to support their objectives and that capitalize on current market opportunities.
Sector forecasts
INDUSTRIAL:
The industrial sector continues to see contrasting fortunes between class A and B/C products. Class A net absorption remained positive and gained pace (+39 MSF in 3Q and +117 MSF in the trailing four quarters) while Class B/C continued falling, albeit at a lesser rate compared to recent negative quarters (-9 MSF in 3Q and -56 MSF in T4Q). Construction deliveries of 49 MSF exceeded net absorption in 3Q25 but have seen a sharp slowdown from the 100 MSF delivery pace during 2023 and 2024. U.S. industrial vacancy increased 10 bps quarter-over-quarter (QoQ) to 6.6%, just below its long-term average (LTA). Active supply underway totals 194 MSF (1.2% of stock), down 80 MSF year-overyear (YoY), now below LTA annual deliveries, and with a healthy preleased rate of 35%. Average asking rents were flat QoQ but saw a slight 0.1% gain YoY.
Despite recent signs of slowing performance, Clarion Partners remains constructive on the sector’s long-term growth outlook, supported by resilient consumer spending, continued e-commerce expansion, network modernization, and supply chain diversification through onshoring and nearshoring. Demand from third-party logistics (3PL) providers and retailers continues to broaden across metro areas and facility types. Over the five-year forecast period, the sector’s performance is expected to strengthen further, aided by manageable nearterm supply pressures.
OFFICE:
Office sector fundamentals remain soft due in large part to slowing job growth and the persistence of hybrid work. However, there are signs that fundamentals are beginning to gradually improve. Nationally, trailing four quarter net absorption as of 3Q25 improved to 0.6% of existing stock (its highest level since 2022), although it was still well below the long-term average of 1.3% of stock. And, supply-side pressure continues to alleviate, with trailing four-quarter completions as of 3Q25 totaling 17.8 MSF, the lowest level in more than a decade. As a result, the office vacancy rate fell by 30 bps YoY to 18.7%, the largest annual decline since 2019. The office market has a relatively long road to recovery ahead, with the current vacancy rate sitting 380 bps above its long-term average. The office market remains heavily bifurcated between trophy-like assets performing well and other commodity type office struggling or treading water.
MULTIFAMILY/ SINGLE-FAMILY RENTALS:
Following a strong spring leasing season, apartment market fundamentals softened modestly in the third quarter, as demand moderated and supply pressures persisted resulting in a QoQ 20 bps increase in the national vacancy rate to 4.4%. The slowdown in demand coincides with weaker employment growth and declining consumer confidence. The current vacancy rate for stabilized assets is 80 bps below its historical norm, underscoring the sector’s overall resilience. Institutional quality starts are down 5.5% YoY and have settled about 60% below the post-pandemic peak. This dynamic is expected to support future rent growth, which remains sluggish – average rent is up just 0.5% YoY, as aggressive concessions remain prevalent in high supply markets.
Scattered Site Single-Family Rentals (SFRs) continue to demonstrate resilient performance, though at a more moderate pace. Rent growth decelerated to 2.6% YoY, down 120 bps from the same period last year and 100 bps below the longterm average. This slowdown is likely influenced by a growing supply of both for-sale and for-rent homes, with 1.5 million homes listed for sale in Q3 – a 2.2% increase over Q2. In contrast, the Build-to-Rent (BTR) segment continues to face headwinds in the form of new deliveries. Rent growth remained subdued at 0.4% YoY, a 30-bps decline from Q2. BTR vacancy held steady at 4.9%.
Looking forward, Clarion Partners anticipates that limited housing affordability will continue to underpin robust rental demand. Nationwide construction pullbacks are expected to tighten supply conditions, supporting stronger rent growth across housing formats going forward. Positive job growth, healthy household formation, and supportive demographic dynamics should further reinforce demand for institutional-grade multifamily, SFR, and build-to-rent communities in a broader set of U.S. markets.
In the years ahead, Clarion Partners believes demand for rental housing is likely to remain robust due to low affordability. New multifamily development starts have fallen by 35.1% year-over-year due to higher financing costs. With the construction pull back nationwide, we expect rent growth for all forms of housing from 2025 onwards to strengthen. Resilient job growth, steady household formation, and generational demographics should provide tailwinds to support more institutional-quality multifamily, as well as SFR and build-torent (BTR) product, in and around a wider range of US metro areas.
RETAIL:
Neighborhood and community centers reported just under 2.0 MSF of completions in 3Q, the seventh consecutive quarter below that level. The total square footage of shopping centers under construction in 3Q amounts to less than 0.3% of existing stock, suggesting there is no meaningful supply response in the offing. Quarterly absorption came in at 1.3 MSF, following a cumulative negative 8.3 MSF in 1Q and 2Q, keeping the availability rate, at 6.8%, 40 bps above the 4Q 2024 level. In the context of minimal construction, net absorption remaining muted suggests that landlords, in the aggregate, may be prioritizing rental growth over sheer occupancy. U.S. annual asking rent growth came in at 1.8%, below the 2Q annual growth rate of 2.0%. After an extended period of limited new development, landlords are benefiting from greater pricing leverage. Rent growth projections for the next five years are meaningfully above both recent performance and long-term trends. Clarion Partners expects top-tier neighborhood, community, and lifestyle centers in high-income, supply-constrained trade areas to outperform. Additionally, rising in-store fulfillment activity and sustained wage and employment gains should continue to support demand through the forecast period.
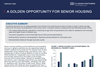
SENIOR HOUSING:
U.S. senior housing market conditions continued to tighten through 3Q25, with net absorption outpacing completions for a 18th consecutive quarter. As a result, occupancy rates have improved from sub-80% levels in 2021 to 89.1% in 3Q, while average rent growth was 4.3% YoY. The sector’s construction pipeline remains in check, with units under construction equating to just 2.3% of existing stock, which is well below the 7% construction rate observed at the height of the previous supply wave from 2016 to 2020. Looking ahead, propelled by the demographic tailwind, specifically the growth of the 80+ year-old population, which is projected to expand by 4.8% per year through 2030, the sector appears poised for strong rent growth. In addition to favorable demographic trends, the financial and physical health of today’s aging cohort relative to prior generations, along with growing constraints on family caregiving, are expected to further support senior housing demand. With new development still constrained by elevated costs and persistent uncertainty, the limited near-term, supply-side pressure should result in a favorable supply-demand imbalance that should promote the sector’s outperformance.
This material does not constitute investment advice, nor does it constitute an offer of any product or service from Clarion Partners LLC or Clarion Partners Europe and should not be viewed as a current or past recommendation to buy or sell any securities. Investment in real estate involves significant risk, including the risk of loss. Investors should consider their investment objectives and risk tolerance before investing.
Performance verification
Certain funds in the US private equity sector measure their performance against NCREIF Property Index, the most widely used benchmark for private equity real estate institutional investments, as well as the NCREIF ODCE Fund Index. Investments in other real estate sectors measure performance against benchmarks specific to their sector and strategy.
COMPLIANCE STATEMENT
Statements regarding forecasts and projections rely on a number of economic and financial variables and are inherently speculative. Forecasts relating to market conditions, returns and other performance indicators are not guaranteed and are subject to change without notice. There can be no assurance that market conditions will perform according to any forecast. Past performance is not a guarantee of future performance. Information contained in this report, including information supporting forecasts and projections, has been obtained or derived from independent third-party sources believed to be reliable but Clarion cannot guarantee the accuracy or completeness of such information. This is not an offer to sell, or solicitation of an offer to buy, securities. This information is intended for use by qualified recipients only.